
Reading House Prices by Bedroom: Where Is the Biggest Jump on the Property Ladder?
By Mark Heneghan MNAEA, Founder of Bespoke Estate Agents
Published: 21 August 2026
The Reading property ladder at a glance
Quick answer: Analysis of 45,802 completed property sales across RG1, RG2, RG4 and RG6 found that the largest difference between historic average prices was between three-bedroom homes and properties with four bedrooms or more.
The average price paid increased from £311,959 for a three-bedroom home to £460,757 for a property with four bedrooms or more. That is a difference of £148,798, or 47.7%.
Nationally, the equivalent difference was 46.8%.
The smallest historic difference in Reading was between two and three-bedroom homes. The average increased by 19.2%, compared with 26.8% nationally.
These figures compare the historic average prices paid within each bedroom category. They do not represent the amount an individual homeowner would need to spend to move today.
Why the average Reading house price does not tell the whole story
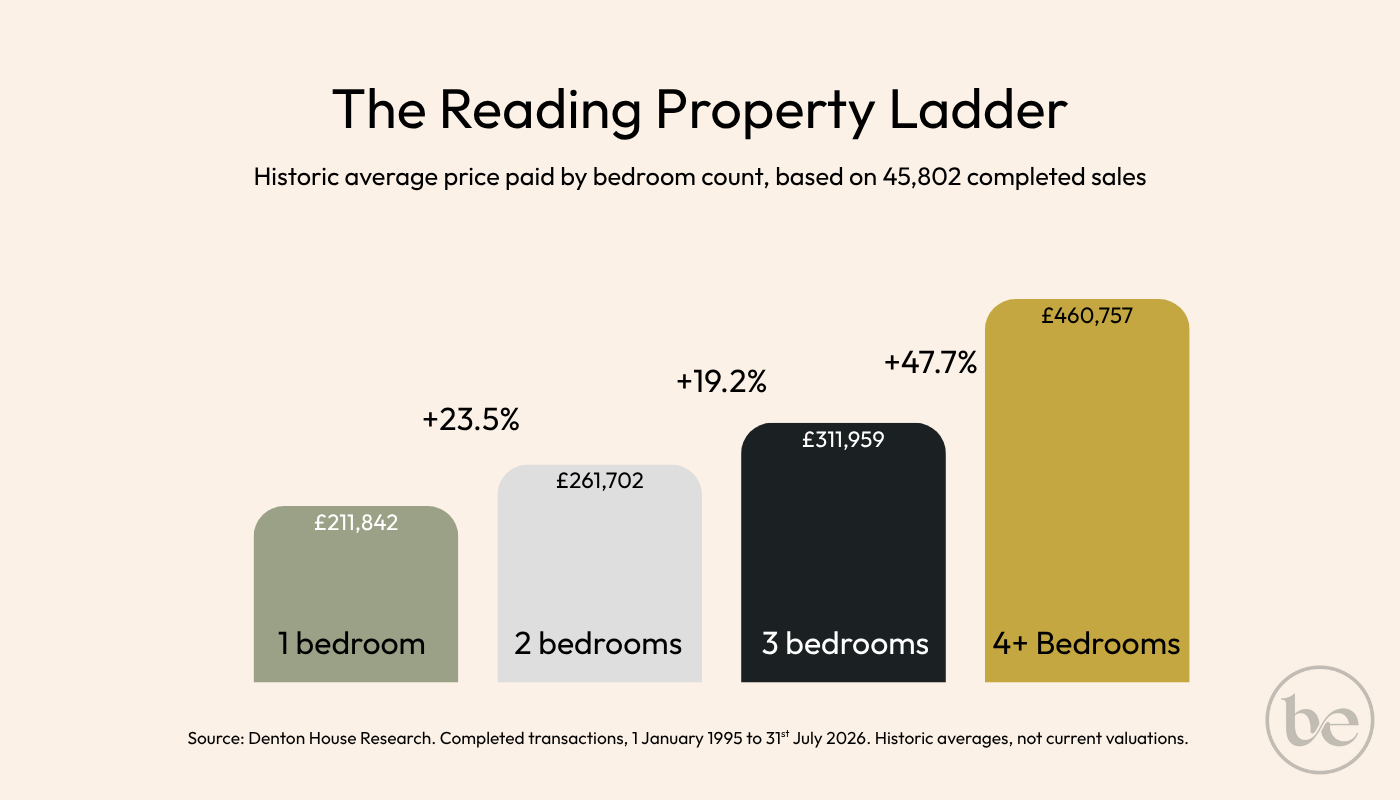
The largest difference between historic average prices in Reading occurs between three-bedroom and four-bedroom-plus homes.
We often talk about the average price of a home in Reading, but a single town-wide figure can hide more than it reveals.
A one-bedroom apartment, a three-bedroom family home and a substantial four-bedroom property serve different buyers and can behave very differently in the market.
Combining them into one overall average does not explain how the Reading property ladder is structured, what types of homes are most commonly sold or where the largest price differences occur.
To build a clearer picture, I analysed 45,802 completed residential property sales across RG1, RG2, RG4 and RG6, recorded between 1 January 1995 and 31 July 2026.
The analysis, supplied by Denton House Research, separates completed transactions by bedroom count and compares Reading with the national market.
Reading property sales by bedroom count
Of the 45,802 completed Reading sales analysed:
Bedrooms | Homes sold | Reading transactions | National transactions |
|---|---|---|---|
One bedroom | 5,898 | 12.9% | 7.38% |
Two bedrooms | 12,328 | 26.9% | 25.98% |
Three bedrooms | 16,570 | 36.2% | 46.06% |
Four bedrooms or more | 11,006 | 24.0% | 20.58% |
Reading recorded a considerably higher proportion of one-bedroom transactions than the national market, at 12.9% compared with 7.38%.
The proportion of two-bedroom sales was broadly similar, while three-bedroom homes accounted for a noticeably smaller share of Reading transactions.
Properties with four bedrooms or more represented 24.0% of Reading sales, compared with 20.58% nationally.
This does not necessarily mean that Reading physically contains more or fewer homes in each category. It shows the mix of properties that completed during the period analysed.
What have buyers historically paid for Reading homes?
Across all the Reading transactions analysed, the historic average prices paid were:
Bedrooms | Historic average price paid |
|---|---|
One bedroom | £211,842 |
Two bedrooms | £261,702 |
Three bedrooms | £311,959 |
Four bedrooms or more | £460,757 |
These are not current asking prices or estimates of what Reading homes are worth today.
A property sold in 1995 forms part of the same dataset as one sold in 2026. The figures should therefore be viewed as a long-term description of completed Reading transactions, rather than a current valuation guide.
Where is the biggest price jump on the Reading property ladder?
The largest difference occurs between three-bedroom homes and properties with four bedrooms or more.
Move | Reading increase | National increase | Reading cash difference |
|---|---|---|---|
One to two bedrooms | 23.5% | 25.6% | £49,860 |
Two to three bedrooms | 19.2% | 26.8% | £50,257 |
Three to four bedrooms or more | 47.7% | 46.8% | £148,798 |
The historic average increased by £148,798 between the three-bedroom and four-bedroom-plus categories in Reading.
That 47.7% difference was slightly higher than the national figure of 46.8%.
By comparison, the difference between two and three-bedroom homes was considerably smaller in Reading than it was nationally, at 19.2% versus 26.8%.
This does not prove that one category offers better value than another. The differences will be affected by the type, location, size, condition and quality of the properties sold within each category.
The four-bedroom-plus category is particularly broad. It includes conventional four-bedroom family homes alongside much larger and more expensive properties, which will naturally influence the average.
Reading house prices by postcode and area
There is no single Reading property market.
RG1, RG2, RG4 and RG6 contain very different combinations of apartments, terraces, suburban family homes and larger properties. This affects both the proportion of transactions in each bedroom category and the average prices recorded.
For clarity, the postcode districts have been accompanied by the principal areas most commonly associated with them:
RG1: Central Reading
RG2: South Reading and Shinfield
RG4: Caversham
RG6: Earley and Lower Earley
Area names are used as a general guide. Postcode districts can include additional neighbourhoods and do not follow exact town, parish or administrative boundaries.
Percentage of transactions by bedroom count
Postcode and area | One bed | Two bed | Three bed | Four-plus |
|---|---|---|---|---|
RG1: Central Reading | 23.8% | 43.3% | 22.5% | 10.3% |
RG2: South Reading and Shinfield | 9.7% | 25.0% | 41.6% | 23.8% |
RG4: Caversham | 5.0% | 18.2% | 44.8% | 32.0% |
RG6: Earley and Lower Earley | 10.4% | 16.9% | 39.0% | 33.6% |
Historic average price paid by postcode and area
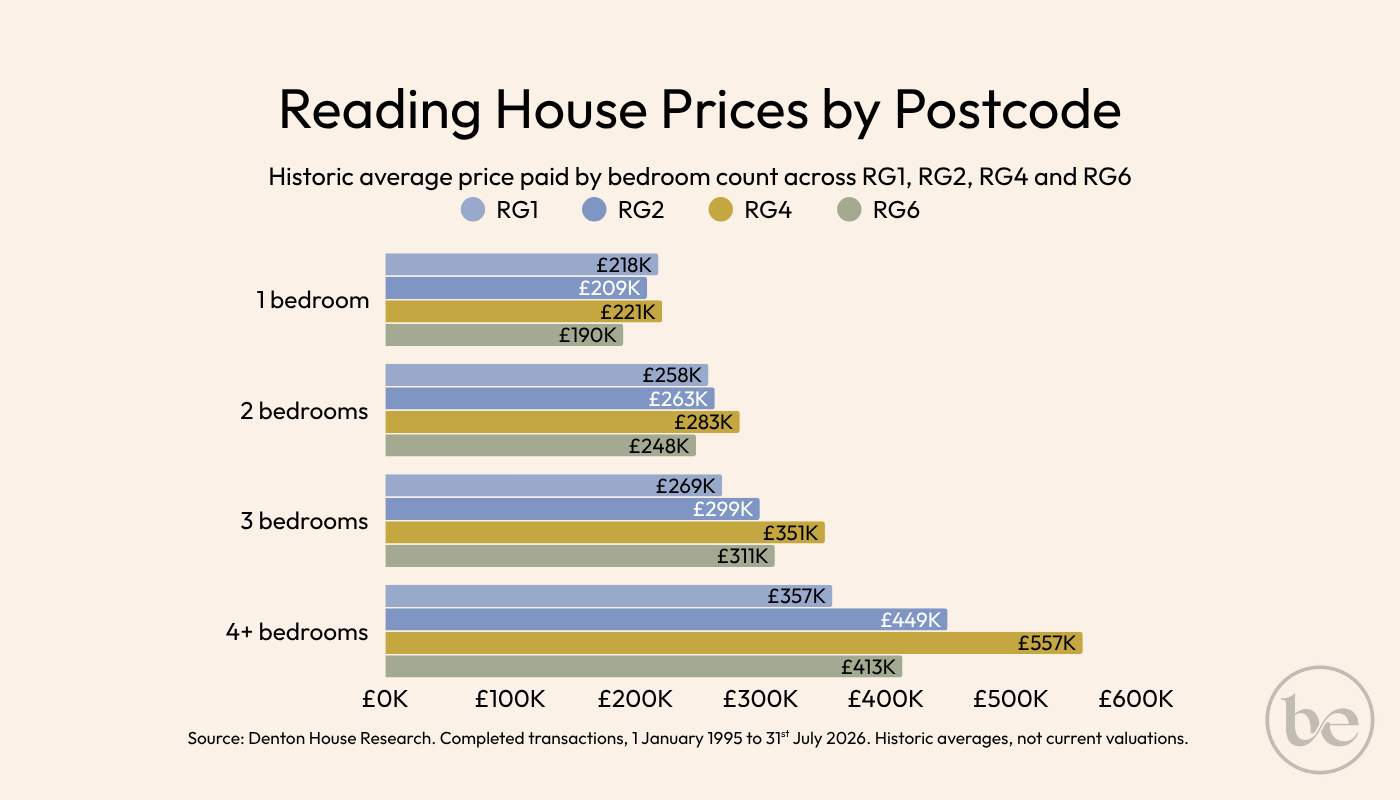
Historic average prices vary significantly across Reading’s principal postcode districts and bedroom categories.
Postcode and area | One bed | Two bed | Three bed | Four-plus |
|---|---|---|---|---|
RG1: Central Reading | £218,395 | £257,596 | £269,432 | £356,675 |
RG2: South Reading and Shinfield | £209,278 | £263,369 | £298,816 | £449,347 |
RG4: Caversham | £220,710 | £282,719 | £350,836 | £556,687 |
RG6: Earley and Lower Earley | £190,131 | £248,467 | £310,575 | £412,545 |
RG1 Central Reading property prices by bedroom
RG1 has the greatest concentration of smaller properties among the four Reading postcode districts analysed.
One and two-bedroom homes accounted for more than two-thirds of completed transactions in RG1. This is consistent with the concentration of apartments and smaller homes found in and around Reading town centre.
The historic average price paid was £218,395 for a one-bedroom home, £257,596 for a two-bedroom home and £269,432 for a three-bedroom home.
Properties with four bedrooms or more accounted for just 10.3% of RG1 transactions, with a historic average price of £356,675.
RG2 South Reading and Shinfield property prices by bedroom
RG2 recorded a much stronger concentration of three-bedroom family homes.
Three-bedroom properties represented 41.6% of transactions, while homes with four bedrooms or more accounted for a further 23.8%.
Almost two-thirds of the RG2 sales analysed therefore involved homes with at least three bedrooms.
Historic average prices ranged from £209,278 for a one-bedroom home to £449,347 for a property with four bedrooms or more.
RG4 Caversham property prices by bedroom
RG4 recorded the highest historic average price in every bedroom category among the four postcode districts analysed.
The average price paid was £220,710 for a one-bedroom home, £282,719 for a two-bedroom home and £350,836 for a three-bedroom home.
For properties with four bedrooms or more, the historic average reached £556,687.
More than three-quarters of RG4 transactions involved homes with at least three bedrooms, reflecting the area’s concentration of established family housing and larger properties.
RG6 Earley and Lower Earley property prices by bedroom
RG6 recorded the largest proportion of four-bedroom-plus transactions, at 33.6%, narrowly ahead of RG4 at 32.0%.
Almost three-quarters of the RG6 transactions analysed involved homes with at least three bedrooms.
Despite this concentration of larger homes, RG6 recorded the lowest historic average price in each bedroom category among the four districts.
This does not mean that individual homes in Earley and Lower Earley are inherently worth less. The figures may reflect differences in property type, location, size, condition and the timing of transactions within each category.
What does this tell us about the Reading property market?
The figures show why town-wide and national averages should be treated as starting points rather than definitive assessments of an individual property.
Central Reading is primarily a market of apartments and smaller homes. South Reading and Shinfield have a strong concentration of three-bedroom properties, while Caversham, Earley and Lower Earley are more heavily weighted towards larger family homes.
Even within the same bedroom category, the price differences between postcode districts can be substantial.
For example, the historic average for a four-bedroom-plus property was £356,675 in RG1, compared with £556,687 in RG4.
This reinforces an important point: bedroom count alone cannot determine the value of a Reading home.
What determines the value of an individual Reading property?
The value and saleability of a home will depend on considerably more than its number of bedrooms.
Important factors include:
Precise location
Property type and architectural style
Internal floor area
Age and overall condition
Plot and garden size
Parking and garaging
School catchment
Leasehold or freehold tenure
Quality of presentation and marketing
Competing properties
Current buyer demand
Two homes with the same number of bedrooms can have very different values, even when they are located within the same postcode district.
The historic data reveals how Reading’s housing market is structured, but an accurate valuation must be based on the individual property and current market conditions.
Important limitations of the analysis
This analysis combines completed property transactions recorded over more than three decades.
It is important to understand that:
The figures are historic averages, not current property valuations.
Prices have not been adjusted for inflation.
The results may be influenced by when transactions took place within each category.
The data does not track individual homeowners as they move between properties.
Bedroom count does not account for differences in floor area, condition, property type or exact location.
The four-bedroom-plus category includes a particularly wide range of homes.
The percentages describe completed transactions, not Reading’s complete housing stock.
The figures are most useful for understanding the long-term shape of the Reading market and comparing recorded transaction categories.
Frequently asked questions
What is the average price of a Reading home by bedroom count?
Across the completed transactions analysed between 1 January 1995 and 31 July 2026, the historic average price paid was £211,842 for a one-bedroom home, £261,702 for a two-bedroom home, £311,959 for a three-bedroom home and £460,757 for a property with four bedrooms or more.
These are long-term historic averages and should not be interpreted as current valuations.
Where is the biggest price jump on the Reading property ladder?
The largest difference between historic average prices occurs between three-bedroom homes and properties with four bedrooms or more.
The average increased from £311,959 to £460,757, a difference of £148,798 or 47.7%.
How much more did buyers historically pay for a three-bedroom home than a two-bedroom home?
The historic average increased from £261,702 for a two-bedroom home to £311,959 for a three-bedroom home.
That represents a difference of £50,257, or 19.2%.
Which Reading area recorded the highest historic average house prices?
Among the four postcode districts analysed, RG4 Caversham recorded the highest historic average price in every bedroom category.
The averages ranged from £220,710 for a one-bedroom property to £556,687 for a home with four bedrooms or more.
Which Reading area had the highest proportion of four-bedroom-plus transactions?
RG6 Earley and Lower Earley recorded the highest proportion of four-bedroom-plus transactions, at 33.6%, followed by RG4 Caversham at 32.0%.
Are these current Reading house prices?
No. The figures combine completed transactions recorded between 1 January 1995 and 31 July 2026.
They provide a long-term picture of the Reading property market and should not be used as a current valuation of an individual home.
Is Reading’s housing market different from the national market?
The completed transactions analysed show a different mix.
One-bedroom homes represented 12.9% of Reading sales, compared with 7.38% nationally. Three-bedroom properties represented 36.2% of Reading transactions, compared with 46.06% nationally.
These figures describe the mix of completed transactions during the period, not the total housing stock in Reading or across the country.
I am considering moving to Reading. Can you help me understand the different areas?
Yes. If you are moving into Reading, I can offer local guidance on areas including Central Reading, South Reading, Shinfield, Caversham, Earley and Lower Earley, as well as the property types and values you are likely to encounter.
Thinking about your next move?
Bedroom count may help position a home on the Reading property ladder, but it cannot determine what an individual property is worth.
Location, floor area, condition, plot, parking, presentation and current buyer demand can all materially affect the result.
If you are considering selling in RG1, RG2, RG4 or RG6, I provide personal, evidence-led property valuations based on your individual home and today’s Reading market.
If you currently live outside the area and are considering a move to Reading, I can also provide local advice and guidance on the different postcode districts, property types and values you are likely to encounter.
Bespoke Estate Agents is a member of the Relocation Agent Network, connecting buyers and sellers with trusted independent estate agents throughout the UK. This means I can also help Reading homeowners who are moving elsewhere by introducing them to an experienced agent in their destination area.
From the initial valuation and marketing strategy through to viewings, negotiations and completion, you deal directly with me throughout.
Whether you are selling in Reading, moving into the area or relocating elsewhere in the UK, contact Mark Heneghan MNAEA at Bespoke Estate Agents.
Local Knowledge. Honest Advice.
About this analysis
This analysis was prepared by Mark Heneghan MNAEA, founder of Bespoke Estate Agents, using completed residential property sales data supplied by Denton House Research.
It covers 45,802 completed transactions across RG1, RG2, RG4 and RG6 between 1 January 1995 and 31 July 2026.
Properties were grouped according to their recorded bedroom count, with the largest category including all properties with four bedrooms or more.
The figures represent historic averages across the complete period analysed. They are not current asking prices or valuations of individual properties.