
If you are considering selling a home in Reading, you may have seen headlines suggesting that the market still favours sellers.
That is not quite what I am seeing.
There are buyers actively looking, and correctly priced properties are agreeing sales. However, buyers have considerably more choice than they did during the exceptionally busy markets of 2021 and 2022.
They are taking longer to compare properties, scrutinising asking prices and negotiating when they believe a home has been priced too ambitiously.
I would therefore describe Reading as an active but highly price-sensitive market. More importantly, our figures show that conditions vary considerably depending on what you are selling, not just where it is located.
The overall market has cooled from its August 2024 peak.
Houses have a higher Sold STC ratio than flats in every Reading postcode analysed.
Houses have approximately 5.2 months of available supply at the current sales pace.
Flats have approximately 11.7 months of available supply.
New flat instructions are entering the market considerably faster than sales are being agreed.
Three and four-bedroom homes between approximately £300,000 and £500,000 represent the strongest part of the current market.
Flats, one-bedroom properties and homes above £750,000 face more challenging conditions.
Reading is not simply a buyers’ or sellers’ market. It is a two-speed market.
One measure frequently used to assess the strength of a property market is the percentage of advertised homes marked as Under Offer or Sold STC compared with the total number of properties being advertised.
Across Reading’s RG1 (Reading town centre), RG2 (South Reading and Shinfield), RG4 (Caversham) and RG6 (Earley and Lower Earley) postcodes, the average August figures have been:
August 2018: 40%
August 2019: 43%
August 2023: 53%
August 2024: 57%
August 2025: 51%
August 2026: 47%
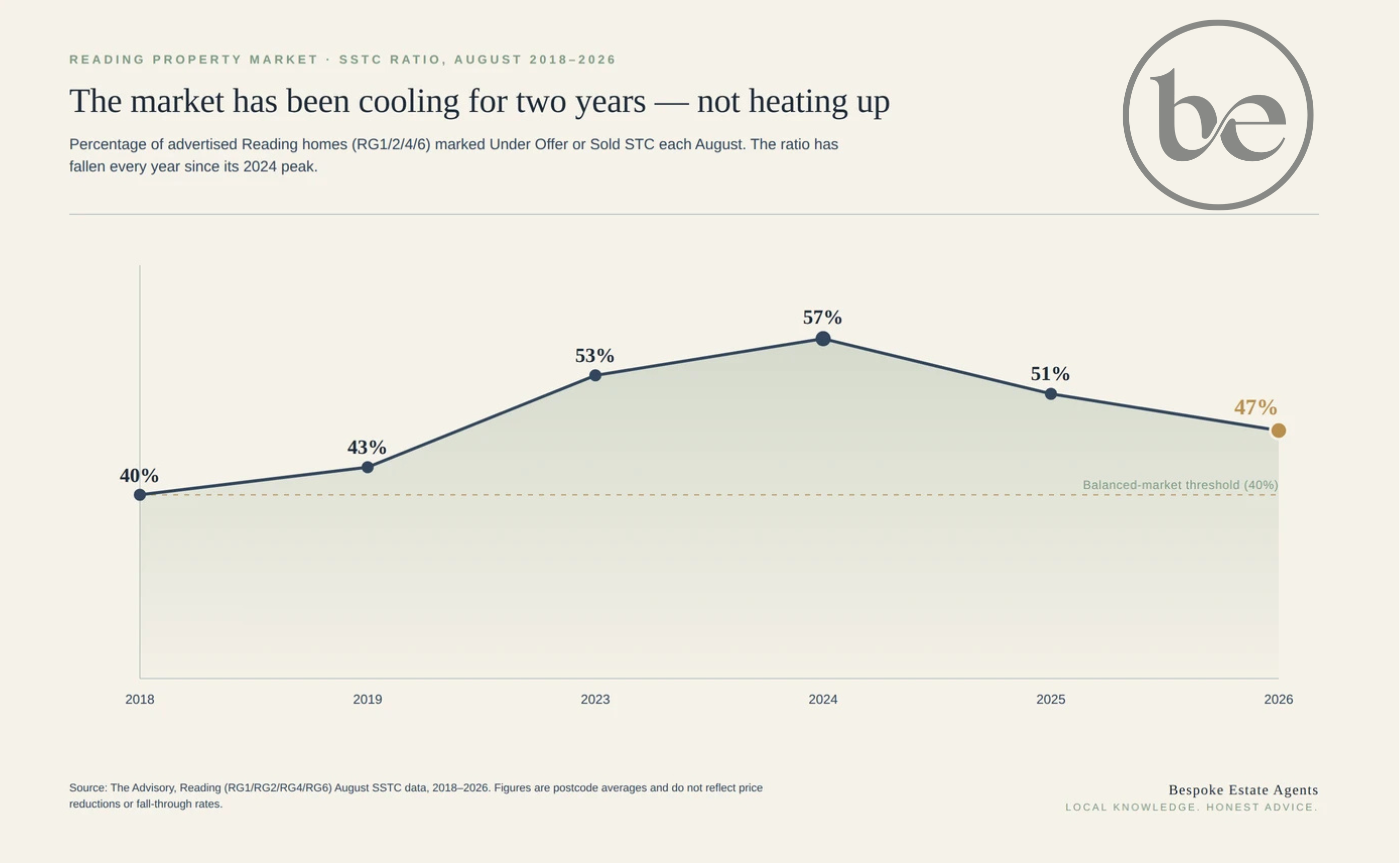
On the surface, a 47% figure might be presented as evidence of a sellers’ market. However, the direction of travel is more revealing.
The ratio has fallen from 57% in August 2024 to 51% in August 2025 and now to 47% in August 2026. The market has therefore been cooling, rather than strengthening, for the past two years.
This percentage must also be treated as a general indicator. A property can remain listed as Sold STC for several months, while the calculation tells us nothing about:
Whether the asking price was reduced
Whether an offer was below the asking price
How long the property took to attract a buyer
Whether the sale subsequently fell through
How many new properties are entering the market
The Sold STC ratio is useful, but it does not prove that sellers hold the upper hand.
Reading agents have traditionally focused on the differences between individual postcodes. Those differences are real, but our own portal data for 1 to 24 August 2026 reveals a much clearer divide.
We analysed houses and flats separately across seven Reading postcodes: RG1 (Reading town centre), RG2 (South Reading and Shinfield), RG4 (Caversham), RG5 (Woodley), RG6 (Earley and Lower Earley), RG30 (West Reading and Tilehurst) and RG31 (Tilehurst and Calcot).
Houses had a higher Sold STC ratio than flats in every postcode.
Postcode | Area | Houses SSTC ratio | Flats SSTC ratio |
|---|---|---|---|
RG1 | Reading town centre | 52.9% | 32.0% |
RG2 | South Reading and Shinfield | 51.9% | 42.6% |
RG4 | Caversham | 51.3% | 42.4% |
RG5 | Woodley | 67.8% | 55.6% |
RG6 | Earley and Lower Earley |
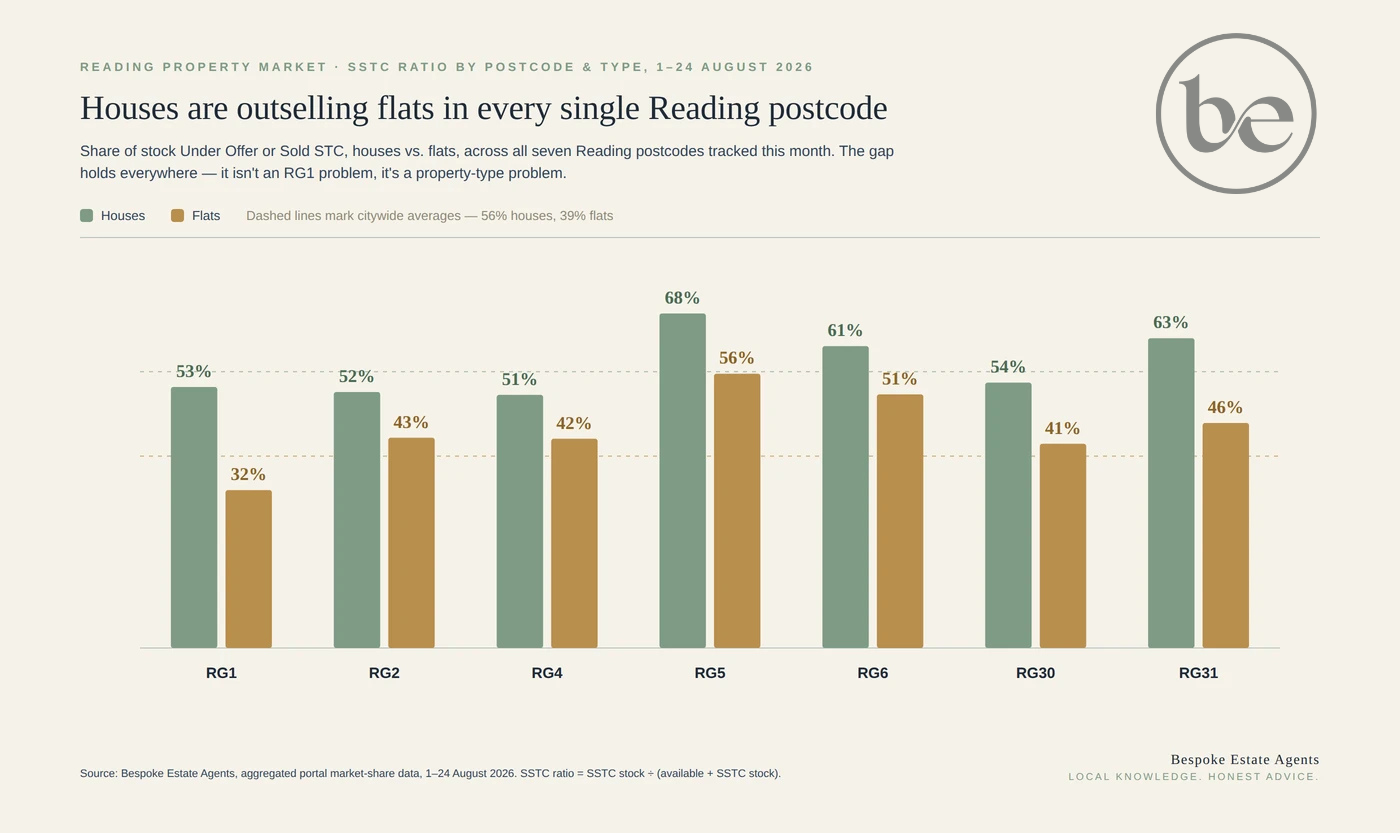
The largest difference can be found in RG1, where houses have a 52.9% Sold STC ratio compared with only 32% for flats.
RG31 also shows a substantial gap, with houses at 62.8% and flats at 45.6%.
Even in RG5, where conditions are comparatively strong for both property types, houses remain ahead at 67.8%, compared with 55.6% for flats.
This does not mean that every house is selling quickly or achieving its asking price. It does, however, demonstrate that available house stock is being absorbed more effectively than flat stock throughout the Reading area.
Across the seven postcodes analysed, the figures were:
Measure | Houses | Flats |
|---|---|---|
Available properties | 1,425 | 714 |
Sold STC properties | 1,816 | 455 |
Sold STC ratio | 56.0% | 38.9% |
New instructions | 225 | 90 |
Sales agreed | 218 | 49 |
Price reductions | 167 | 105 |
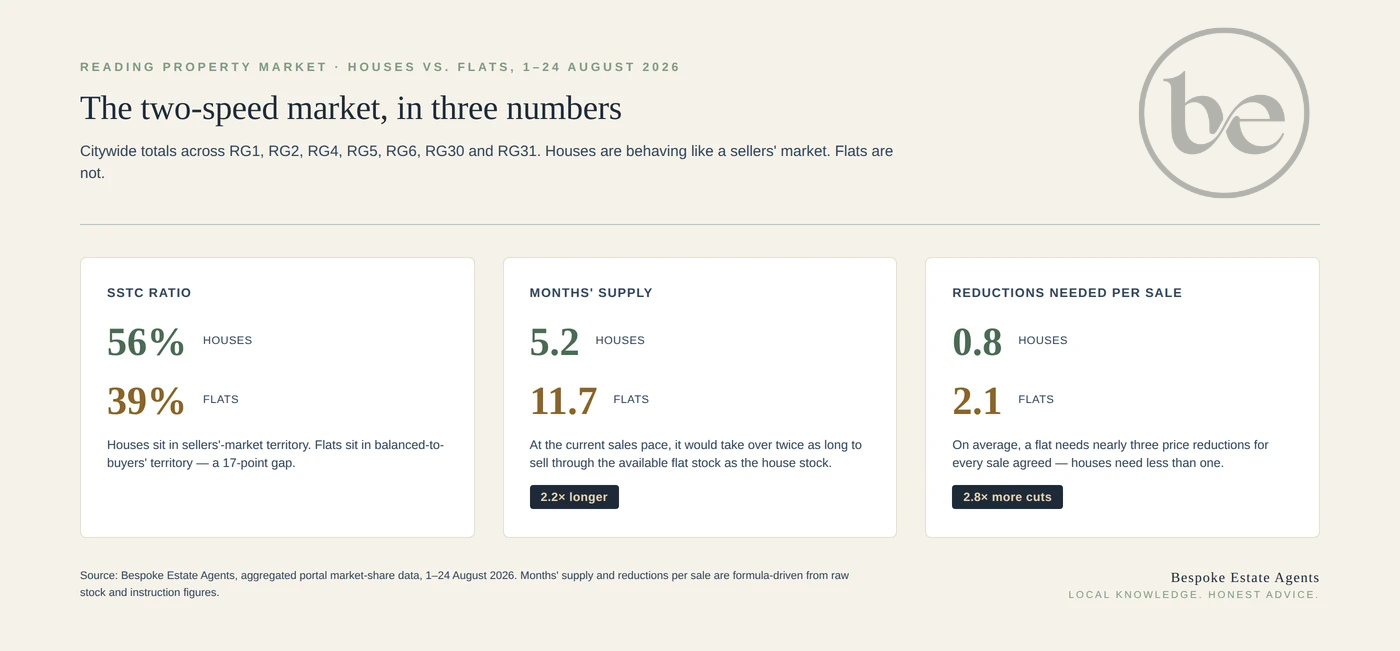
The figures reveal three important differences.
At the current sales-agreed pace, Reading has approximately 5.2 months of available house supply and 11.7 months of available flat supply.
This does not mean that the average house takes 5.2 months to sell or that the average flat takes 11.7 months.
It means that, if sales continued at the current pace and no additional properties entered the market, it would take approximately 5.2 months to absorb the available house stock and 11.7 months to absorb the available flat stock.
During the period analysed, 225 houses entered the market and 218 house sales were agreed. That is close to equilibrium, with new house instructions exceeding sales agreed by only seven.
The flat market tells a very different story. There were 90 new flat instructions but only 49 sales agreed, meaning new instructions exceeded sales by 41 during the period.
This does not automatically mean available stock increased by exactly 41, because withdrawals, fall-throughs and changes of status also affect stock levels. However, it is a clear indication that new flat supply is entering the market considerably faster than buyers are agreeing purchases.
There were 167 house price reductions against 218 house sales agreed, equivalent to 0.77 reductions for every sale.
For flats, there were 105 reductions against only 49 sales agreed, equivalent to 2.14 reductions for every sale.
A reduction does not necessarily relate to the same property as a sale, so this should be treated as a market-level comparison rather than a direct transaction measure.
Nevertheless, the difference is significant. Flat sellers are considerably more likely to be competing against other properties that have already adjusted their asking prices.
Although flats face more difficult conditions overall, the scale of the challenge varies by postcode.
RG1 has approximately 19.9 months of available flat supply at the current sales pace. There were 40 new instructions, only 14 sales agreed and 60 price reductions during the period.
RG5 recorded a much stronger 55.6% Sold STC ratio for flats, but its estimated months of supply remained high because only one flat sale was agreed during the relatively short reporting period. This is a good example of why no single statistic should be considered in isolation, particularly when the sample size is small.
RG6 appears more stable, with five new flat instructions and five sales agreed. However, seven flats were reduced, showing that pricing remains important even where the balance between new listings and sales appears healthier.
We also analysed the Reading market by bedroom count.
Three-bedroom homes recorded the highest Sold STC ratio at approximately 61%, followed by four-bedroom homes at 54%.
At either end of the market, demand was softer:
One-bedroom properties: approximately 40%
Two-bedroom properties: below the three-bedroom peak
Three-bedroom properties: approximately 61%
Four-bedroom properties: approximately 54%
Five-bedroom-plus properties: approximately 42%
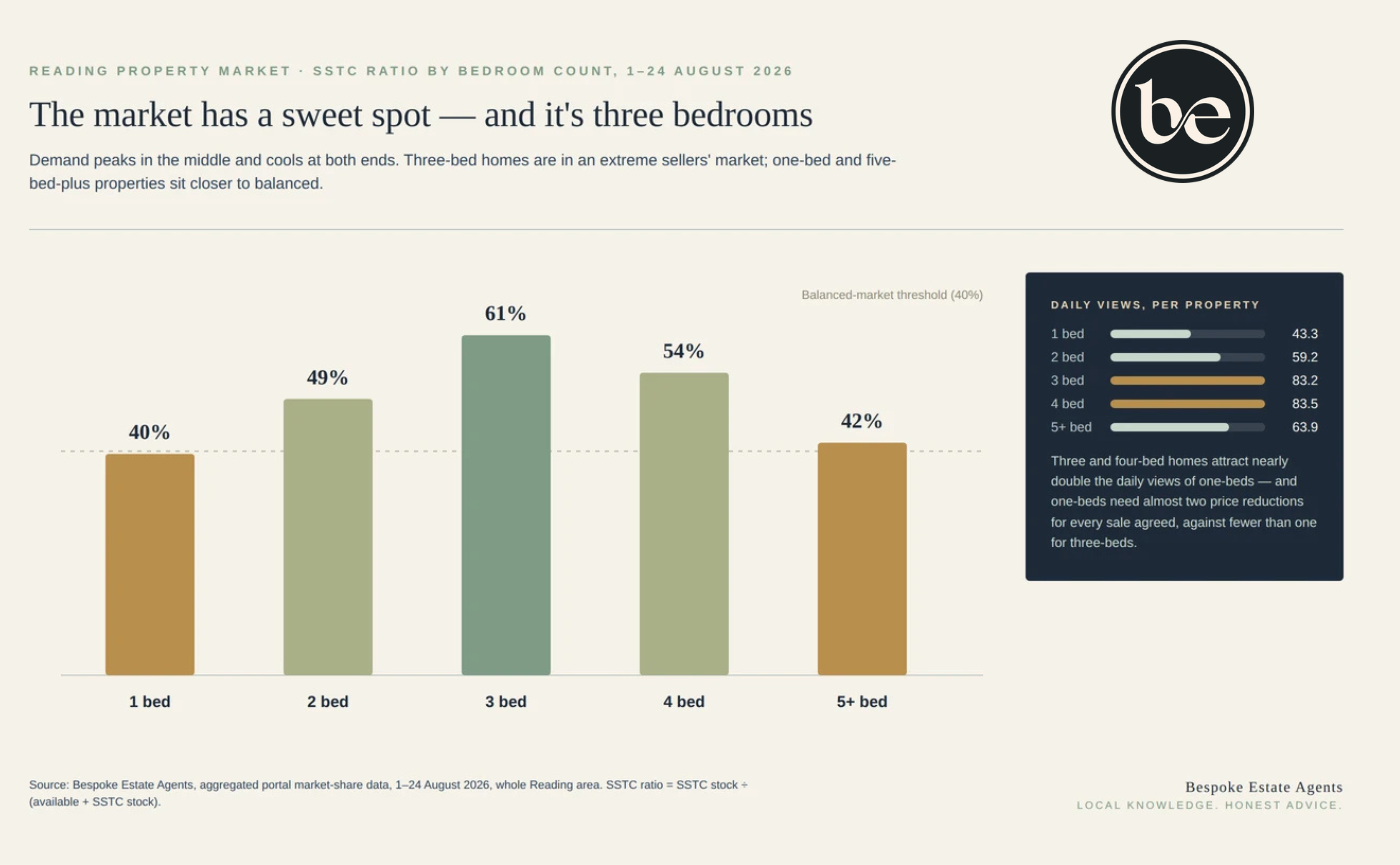
The property-viewing data supports this pattern.
Three and four-bedroom homes attracted approximately 83 detailed property views per day, compared with around 43 for one-bedroom properties.
Buyers are therefore not simply taking longer to purchase smaller homes. The online data suggests that many one-bedroom properties are attracting less initial interest in the first place.
One-bedroom properties also overlap heavily with Reading’s flat market, which helps explain why the bedroom and property-type figures tell a similar story.
The five-bedroom-plus category contains the smallest sample, so its percentage should be treated as a general indication rather than a precise measure of the entire upper market.
Analysing the same market by asking-price band produces a similar pattern.
Demand builds through Reading’s lower and middle price ranges before peaking between £300,000 and £500,000.
The £301,000 to £400,000 band recorded a Sold STC ratio of approximately 62%, while the £401,000 to £500,000 band stood at approximately 59%.
Conditions then became progressively softer:
£750,000 to £1 million: approximately 45%
Above £1 million: approximately 29%
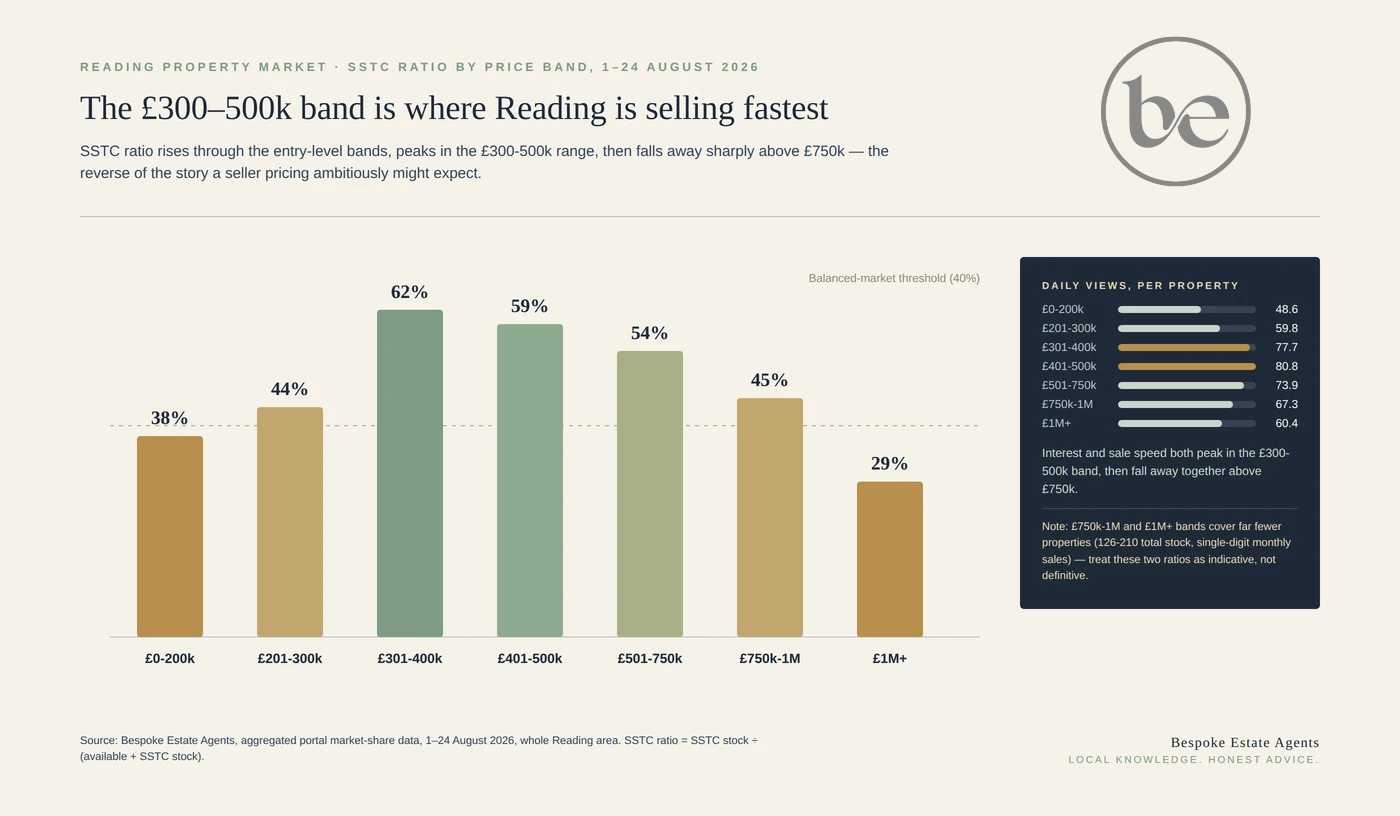
This is likely to be closely connected to the bedroom data. A substantial proportion of Reading’s three and four-bedroom family homes fall within the £300,000 to £500,000 range.
The upper price bands contain fewer properties and relatively few monthly sales. One or two additional transactions could therefore move the percentages considerably.
The figures show that the upper market is softer, but they should not be overinterpreted from one short reporting period.
The question of whether Reading is a buyers’ or sellers’ market does not have one universal answer.
If you own a well-presented three or four-bedroom family house within the £300,000 to £500,000 range, you are operating in the strongest part of the current market.
There are active buyers, high levels of online interest and comparatively limited available supply.
However, that does not mean any asking price will work. Buyers remain price-conscious and will compare your home with every credible alternative.
If you are selling a flat, a one-bedroom property or a home at the upper end of the market, conditions are more difficult.
That does not mean your property cannot sell. It means your launch strategy must reflect the amount of competing stock, current buyer demand and the prices being achieved by genuinely comparable properties.
Starting too high can result in:
Fewer online views
Fewer enquiries and viewings
A longer time on the market
One or more asking-price reductions
Buyers questioning why the property has not sold
The initial asking price should be based on the market for your specific type of property, not a general Reading average.
If you are looking for a three or four-bedroom family house between £300,000 and £500,000, you should be prepared to act decisively.
This is the most competitive part of the Reading market. Correctly priced homes can still attract strong early interest, and waiting too long may mean losing the property to another buyer.
If you are looking at flats, one-bedroom properties or homes above £750,000, you are likely to have more choice and greater negotiating power.
Properties that have been available for several weeks, or that have already reduced their asking price, may have sellers who are more willing to discuss a realistic offer.
In either market, preparation matters.
Having a mortgage agreement in principle, a clear budget and, where applicable, your own property already on the market or under offer will strengthen your position.
Reading is not one property market in August 2026. It is several markets moving at different speeds.
The evidence points to:
An overall market that has cooled from its 2024 peak
Stronger conditions for houses than flats in every postcode analysed
A relatively balanced flow of new instructions and sales agreed for houses
A growing imbalance between new supply and sales agreed for flats
Particularly strong demand for three and four-bedroom family homes
A market sweet spot between approximately £300,000 and £500,000
More challenging conditions above £750,000
Buyers remaining highly sensitive to price across every market segment
Describing the whole of Reading as a sellers’ market is therefore too simplistic.
A more accurate description is an active, price-sensitive and increasingly two-speed market, with houses generally outperforming flats and family homes occupying the strongest position.
Reading is not one uniform market. Family houses, particularly three and four-bedroom homes, generally favour sellers. Flats, one-bedroom properties and homes at the top end of the market give buyers considerably more choice and negotiating power.
Yes. Houses have a higher Sold STC ratio than flats in every Reading postcode included in our analysis. Across the combined area, houses represent approximately 5.2 months of available supply at the current sales pace, compared with around 11.7 months for flats.
RG5, covering Woodley, has the strongest market for houses in this analysis, with approximately 68% of advertised houses marked Sold STC. RG31 and RG6 are also performing strongly, at approximately 63% and 61% respectively.
Flats are selling, but the market is much more price-sensitive. There is more available supply, fewer sales relative to new listings and considerably greater reliance on asking-price reductions. A realistic launch price and strong presentation are therefore particularly important.
Three-bedroom homes currently have the highest Sold STC ratio, at approximately 61%. Properties priced between £301,000 and £400,000 are also performing particularly strongly, with an approximate ratio of 62%.
A reduction should not be automatic. However, limited viewings, weak online engagement and competing properties agreeing sales are all signs that the asking price may need reviewing. The correct decision should be based on the property type, postcode, competition and buyer activity rather than the Reading-wide average alone.
If you are considering selling and would like a straightforward assessment of where your particular property sits within this market, I would be happy to talk through the evidence and the most appropriate strategy for bringing it to market.
Mark Heneghan MNAEA
Founder, Bespoke Estate Agents
Local Knowledge. Honest Advice.
Sources: The Advisory, historic August Sold STC trend covering RG1, RG2, RG4 and RG6 from 2018 to 2026. Bespoke Estate Agents, aggregated portal market-share data covering RG1, RG2, RG4, RG5, RG6, RG30 and RG31 from 1 to 24 August 2026. Bedroom and price-band figures are based on the wider Reading area analysed during the same reporting period.
61.2% |
51.4% |
RG30 | West Reading and Tilehurst | 53.8% | 41.4% |
RG31 | Tilehurst and Calcot | 62.8% | 45.6% |
Reductions per sale agreed
0.77 |
2.14 |
Average daily property views | 80.0 | 47.4 |
Estimated months of supply | 5.2 | 11.7 |